
2020 - 2022
Scattered Data to Usable Insights
UX research studies were producing data no one could easily use. Building a centralized reporting system cut analysis time and improved decision-making.
Data that existed but wasn't usable
Teams were running a high volume of studies, generating real data every week, but that data lived in disconnected files and formats, with no consistent way to pull insights across studies. Decision-makers had access to information, technically, but not in a form they could actually use to make a call.

Building a system, not a spreadsheet
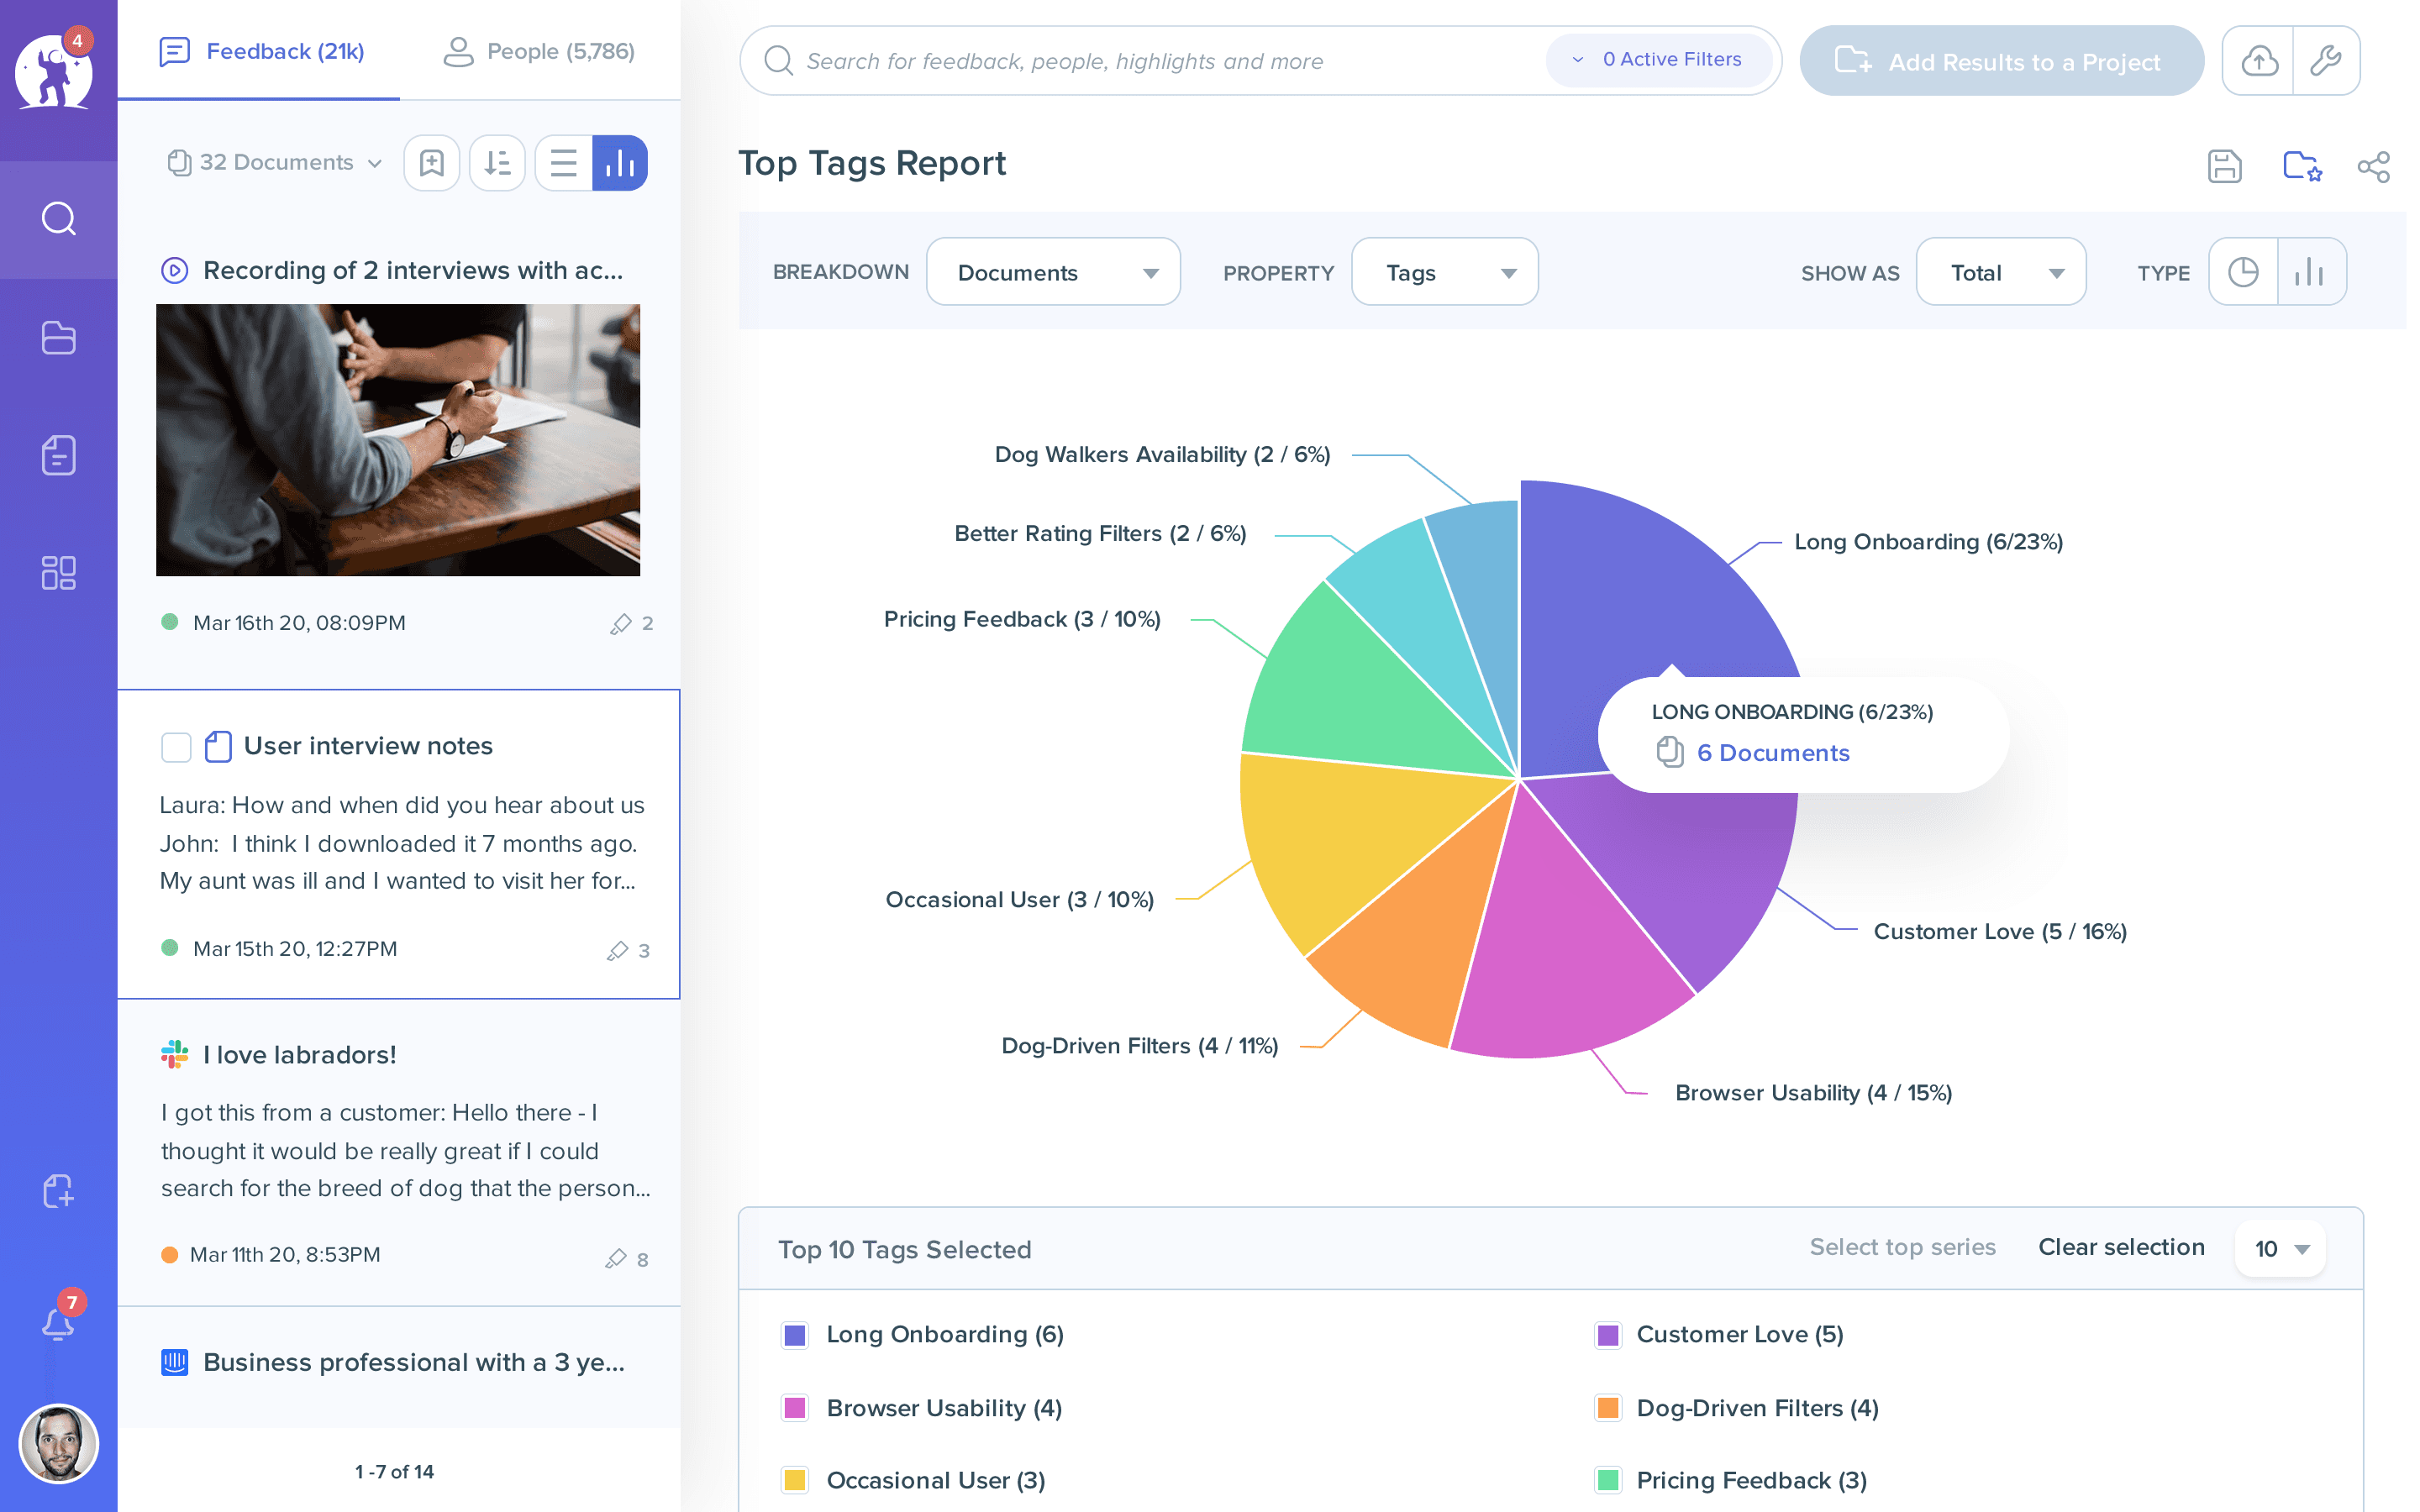
I designed and built a centralized reporting infrastructure that standardized how data came in from every study, then structured it so patterns and insights could be pulled across studies, not just within one at a time. This meant defining consistent intake formats, tagging conventions, and a repository structure that made past findings searchable instead of buried.
Faster answers, better decisions
The result was a measurable drop in the time it took teams to go from raw data to an actual decision, insights that used to take days to compile and cross-reference became accessible in a fraction of the time. This is the same instinct I bring to every engagement now: data isn't useful sitting in a file, it's useful when it's built into a system people can actually pull from.

